
Cost assessment charts for download
Planning to hold a presentation on solar hat applications in your country? Thinking about posting news articles to your website? Use the solar heat cost charts available for download here and reference @Solar Payback/IRENA 2022.
Large solar heat plants show cost reductions in three market segments

In the category of large solar heat plants, there are three main types of clients: industries with a high energy demand for heat (SHIP), utilities running district heating networks (SDH) and buildings from the service sector (hospitals, hotels, sport centres, multi-family houses etc.).
Download the chart
Collector types supply different temperature levels
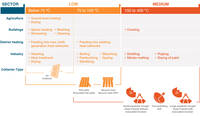
For solar thermal systems, the collector type depends on the type of client with its required temperature. The necessary solar thermal equipment for various temperature levels have a significant impact on the costs.
Trends of solar heat costs of major markets
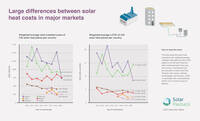
Weighted-average total installed costs and levelised cost of heat are shown for all commercial & industrial solar heat plants in major markets. The figures mark the end point of each trend line. Projects with various collector technologies are included.
Solar heat costs for different applications in out outside Europe
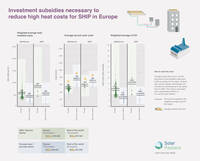
Total installed costs of solar thermal systems in industry are in average higher than of those systems in the building or energy sector. Solar industrial heat plants, therefore, merits financial support particiulary in Europe, while fossil fuels don't pay for their negative externalities.
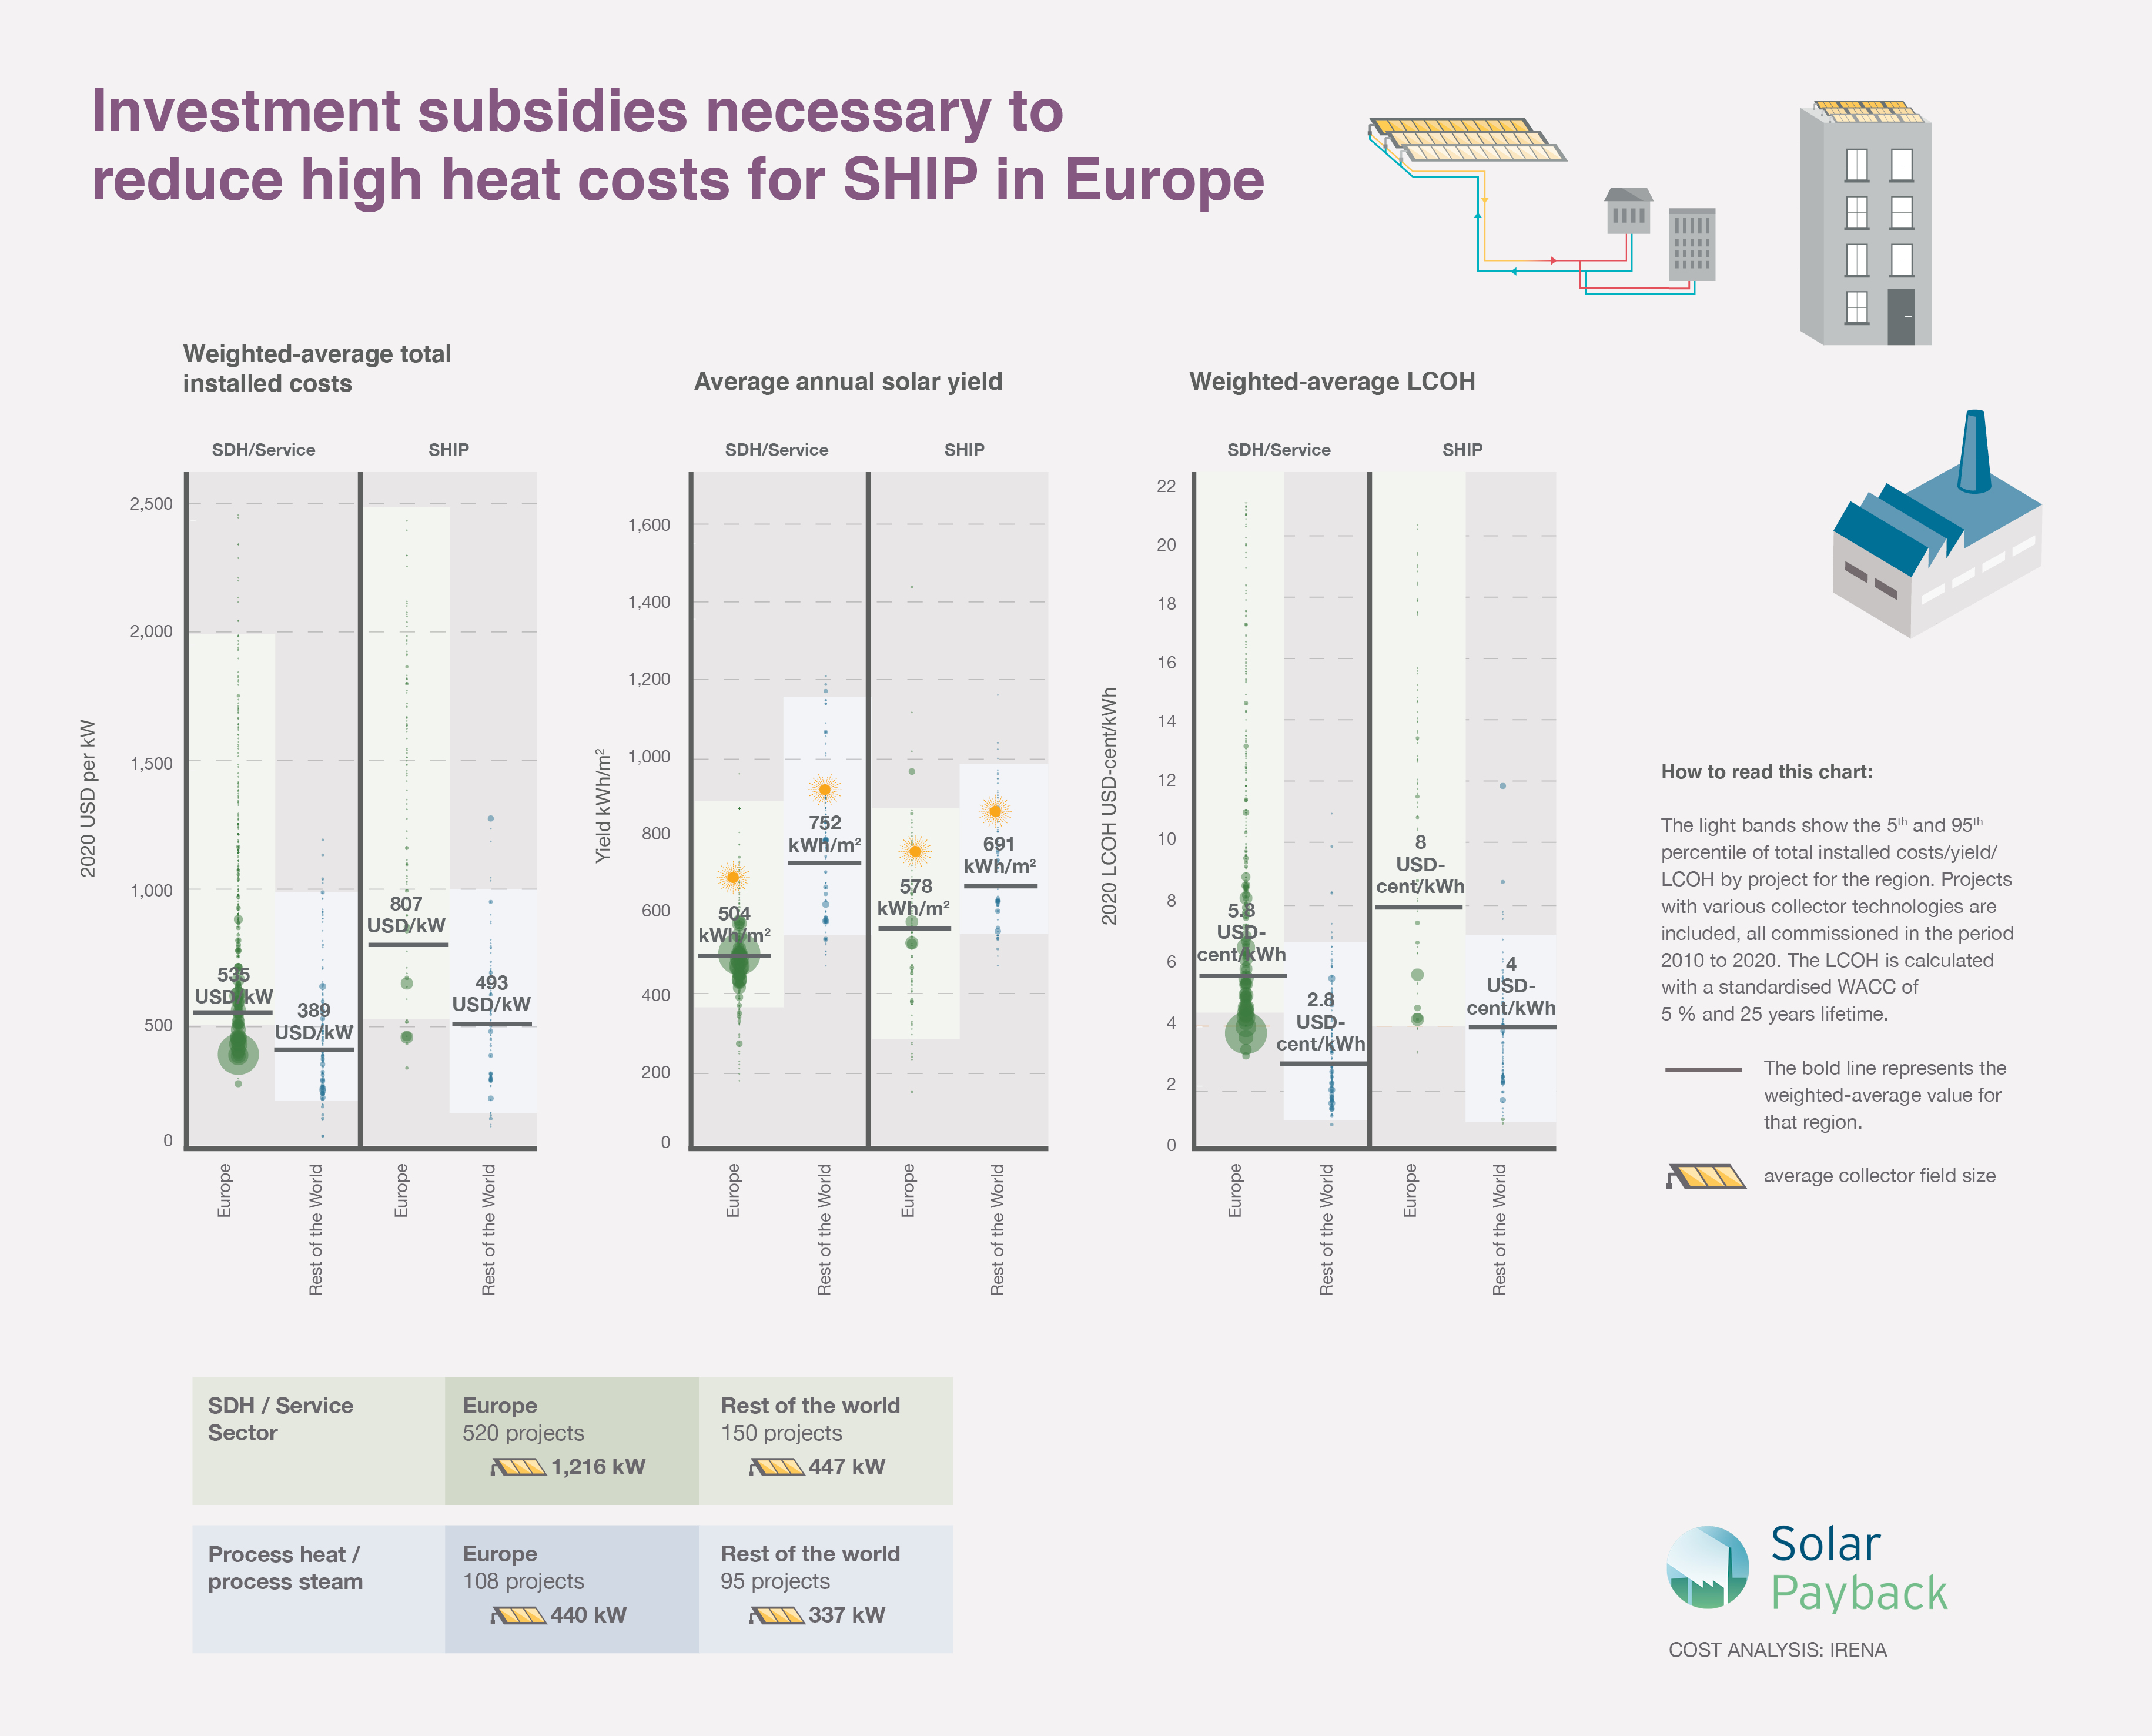
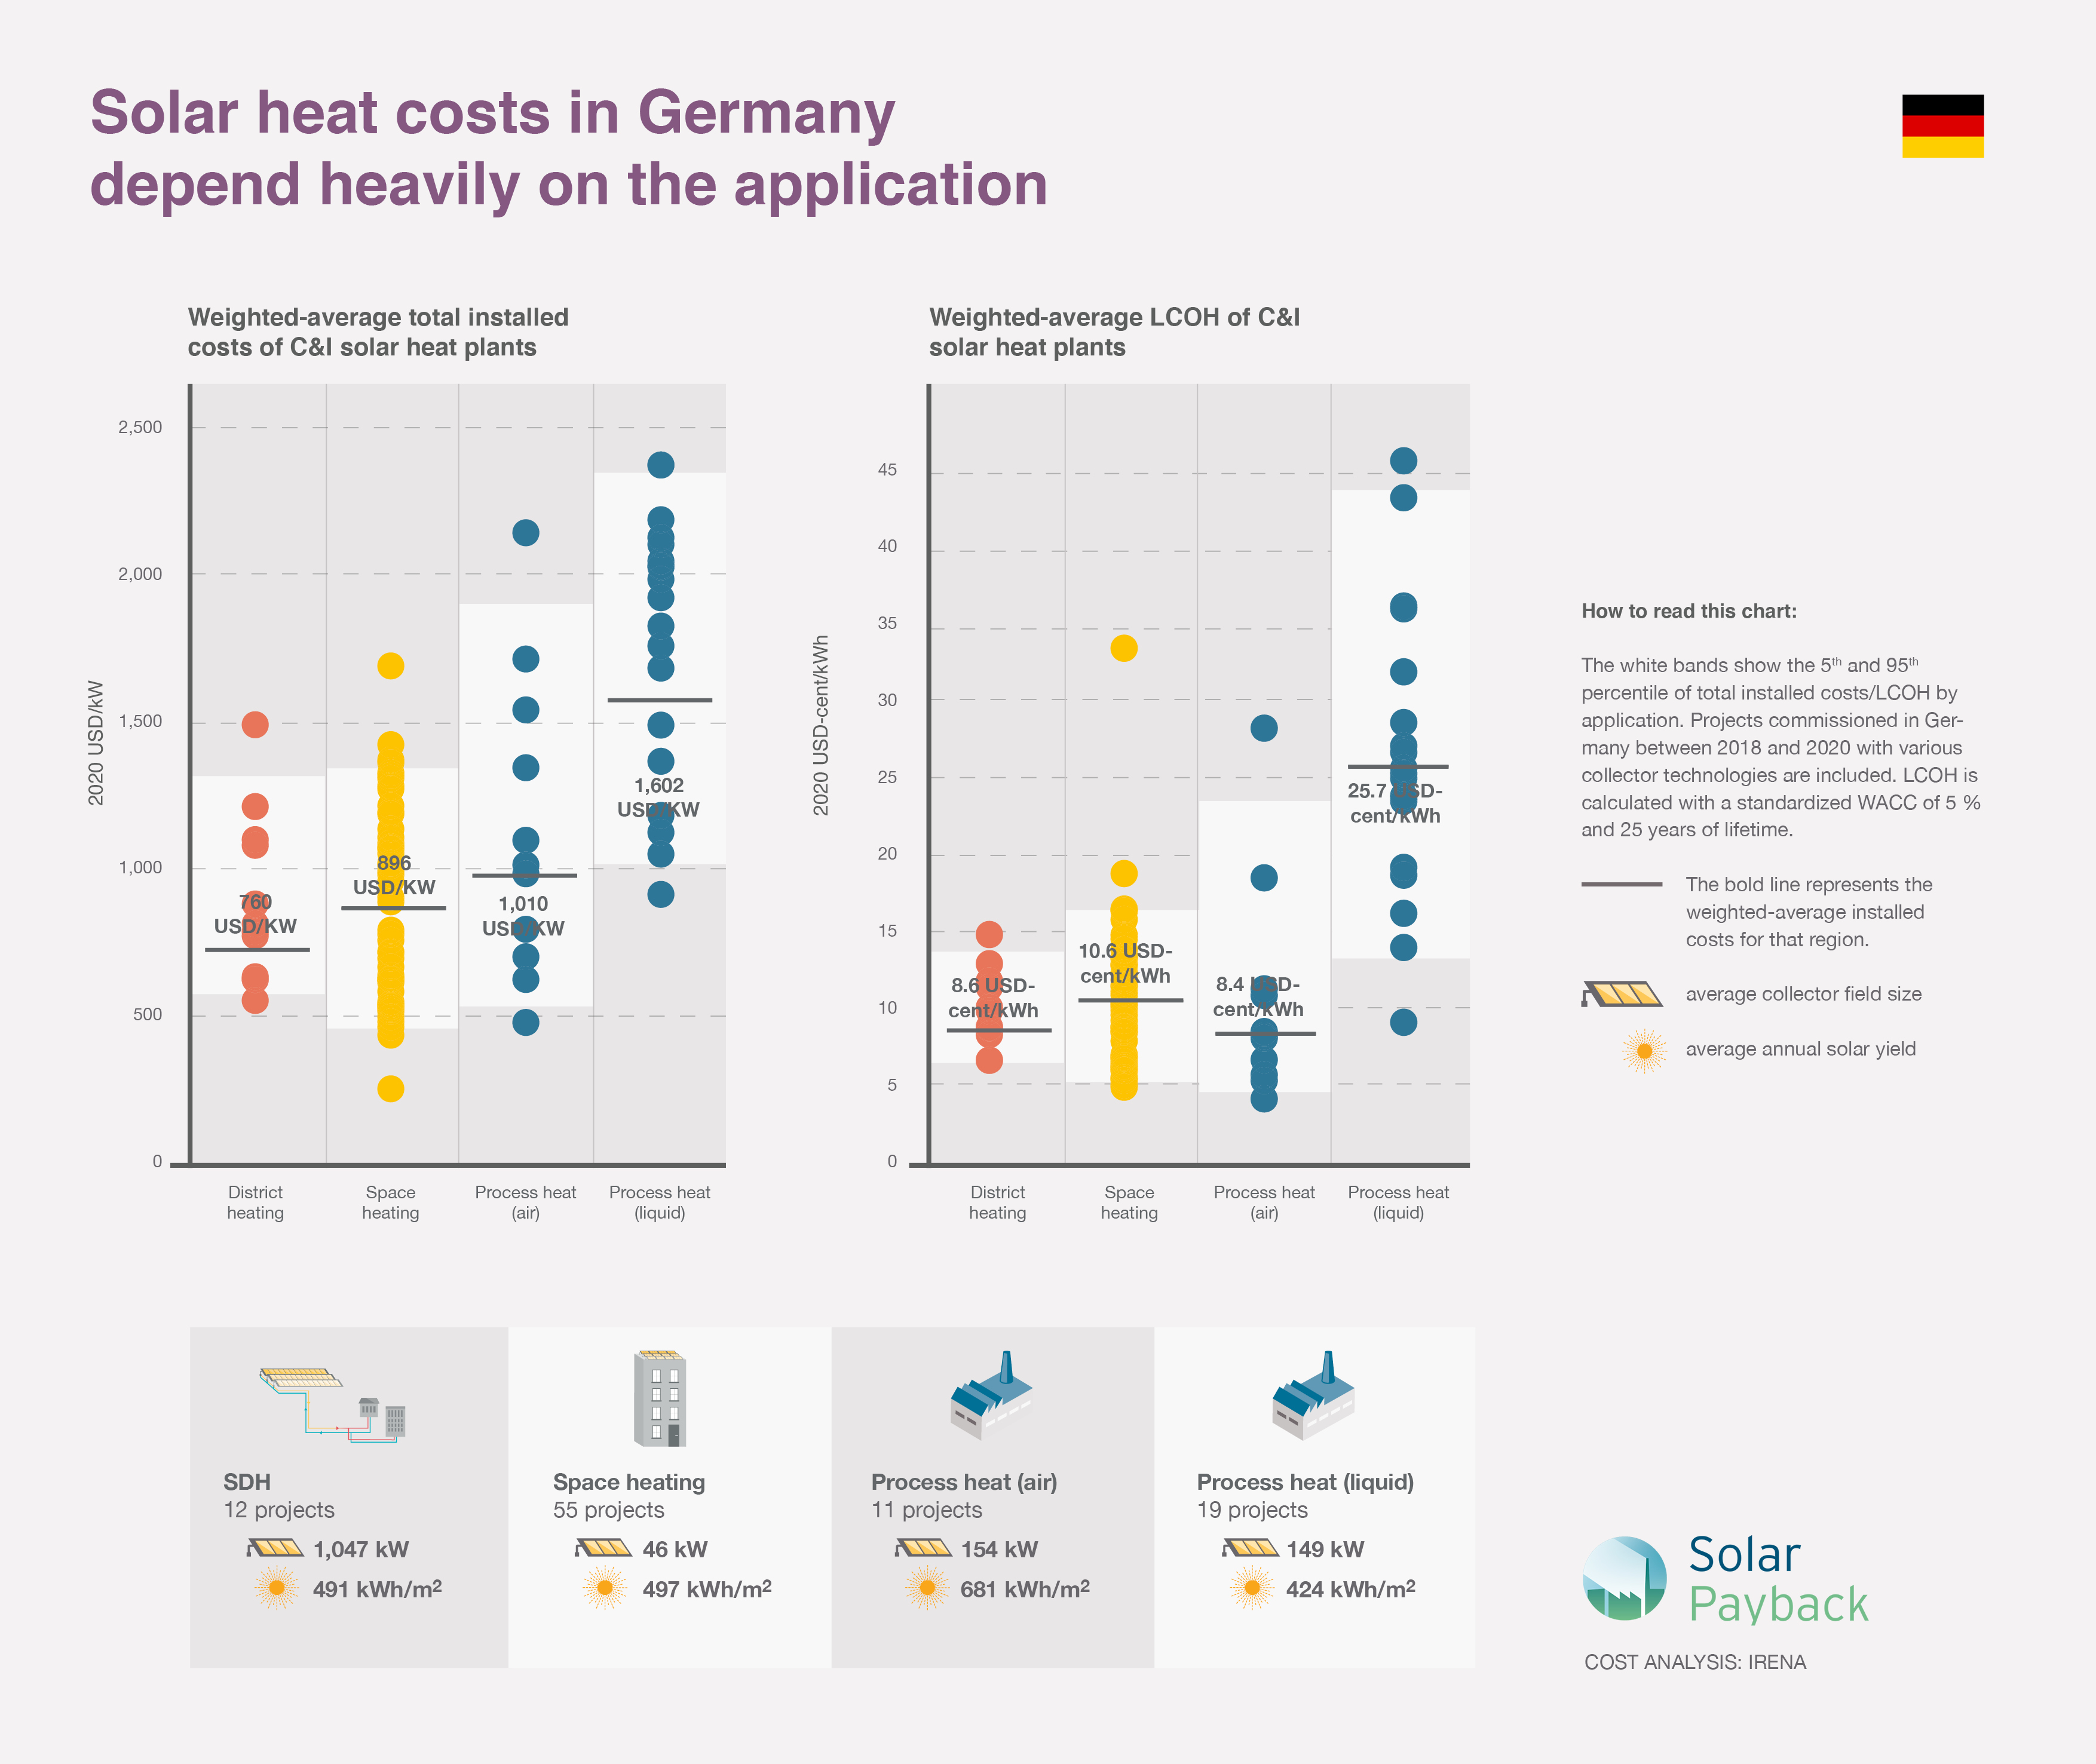
Solar heat costs in Germany depending on application
Costs for 97 solar thermal systems commissioned in Germany between 2018 and 2020 are marked with dots on this chart. The four applications show a different cost structure. The data was provided by the administrator of the national subsidy scheme.
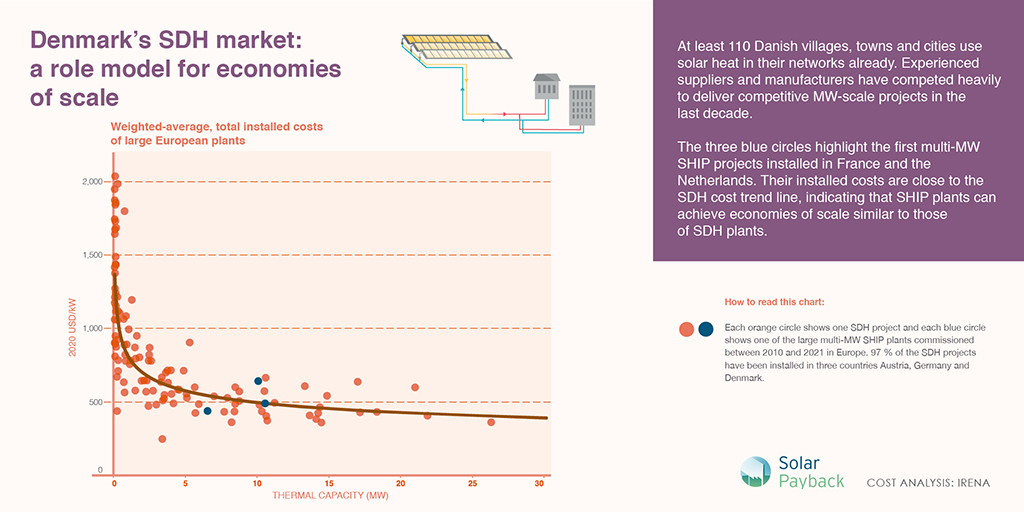
Denmark's SDH market: a role model for economies of scale
The European SDH market has achieved great economies of scale due to Denmark’s leading role. Each orange circle shows one SDH project and each blue circle shows one of the large multi-MW SHIP plants commissioned between 2010 and 2021 in Europe. The trend curve suggests that for every doubling of the size of the plant, total installed costs will decline by 14 %.
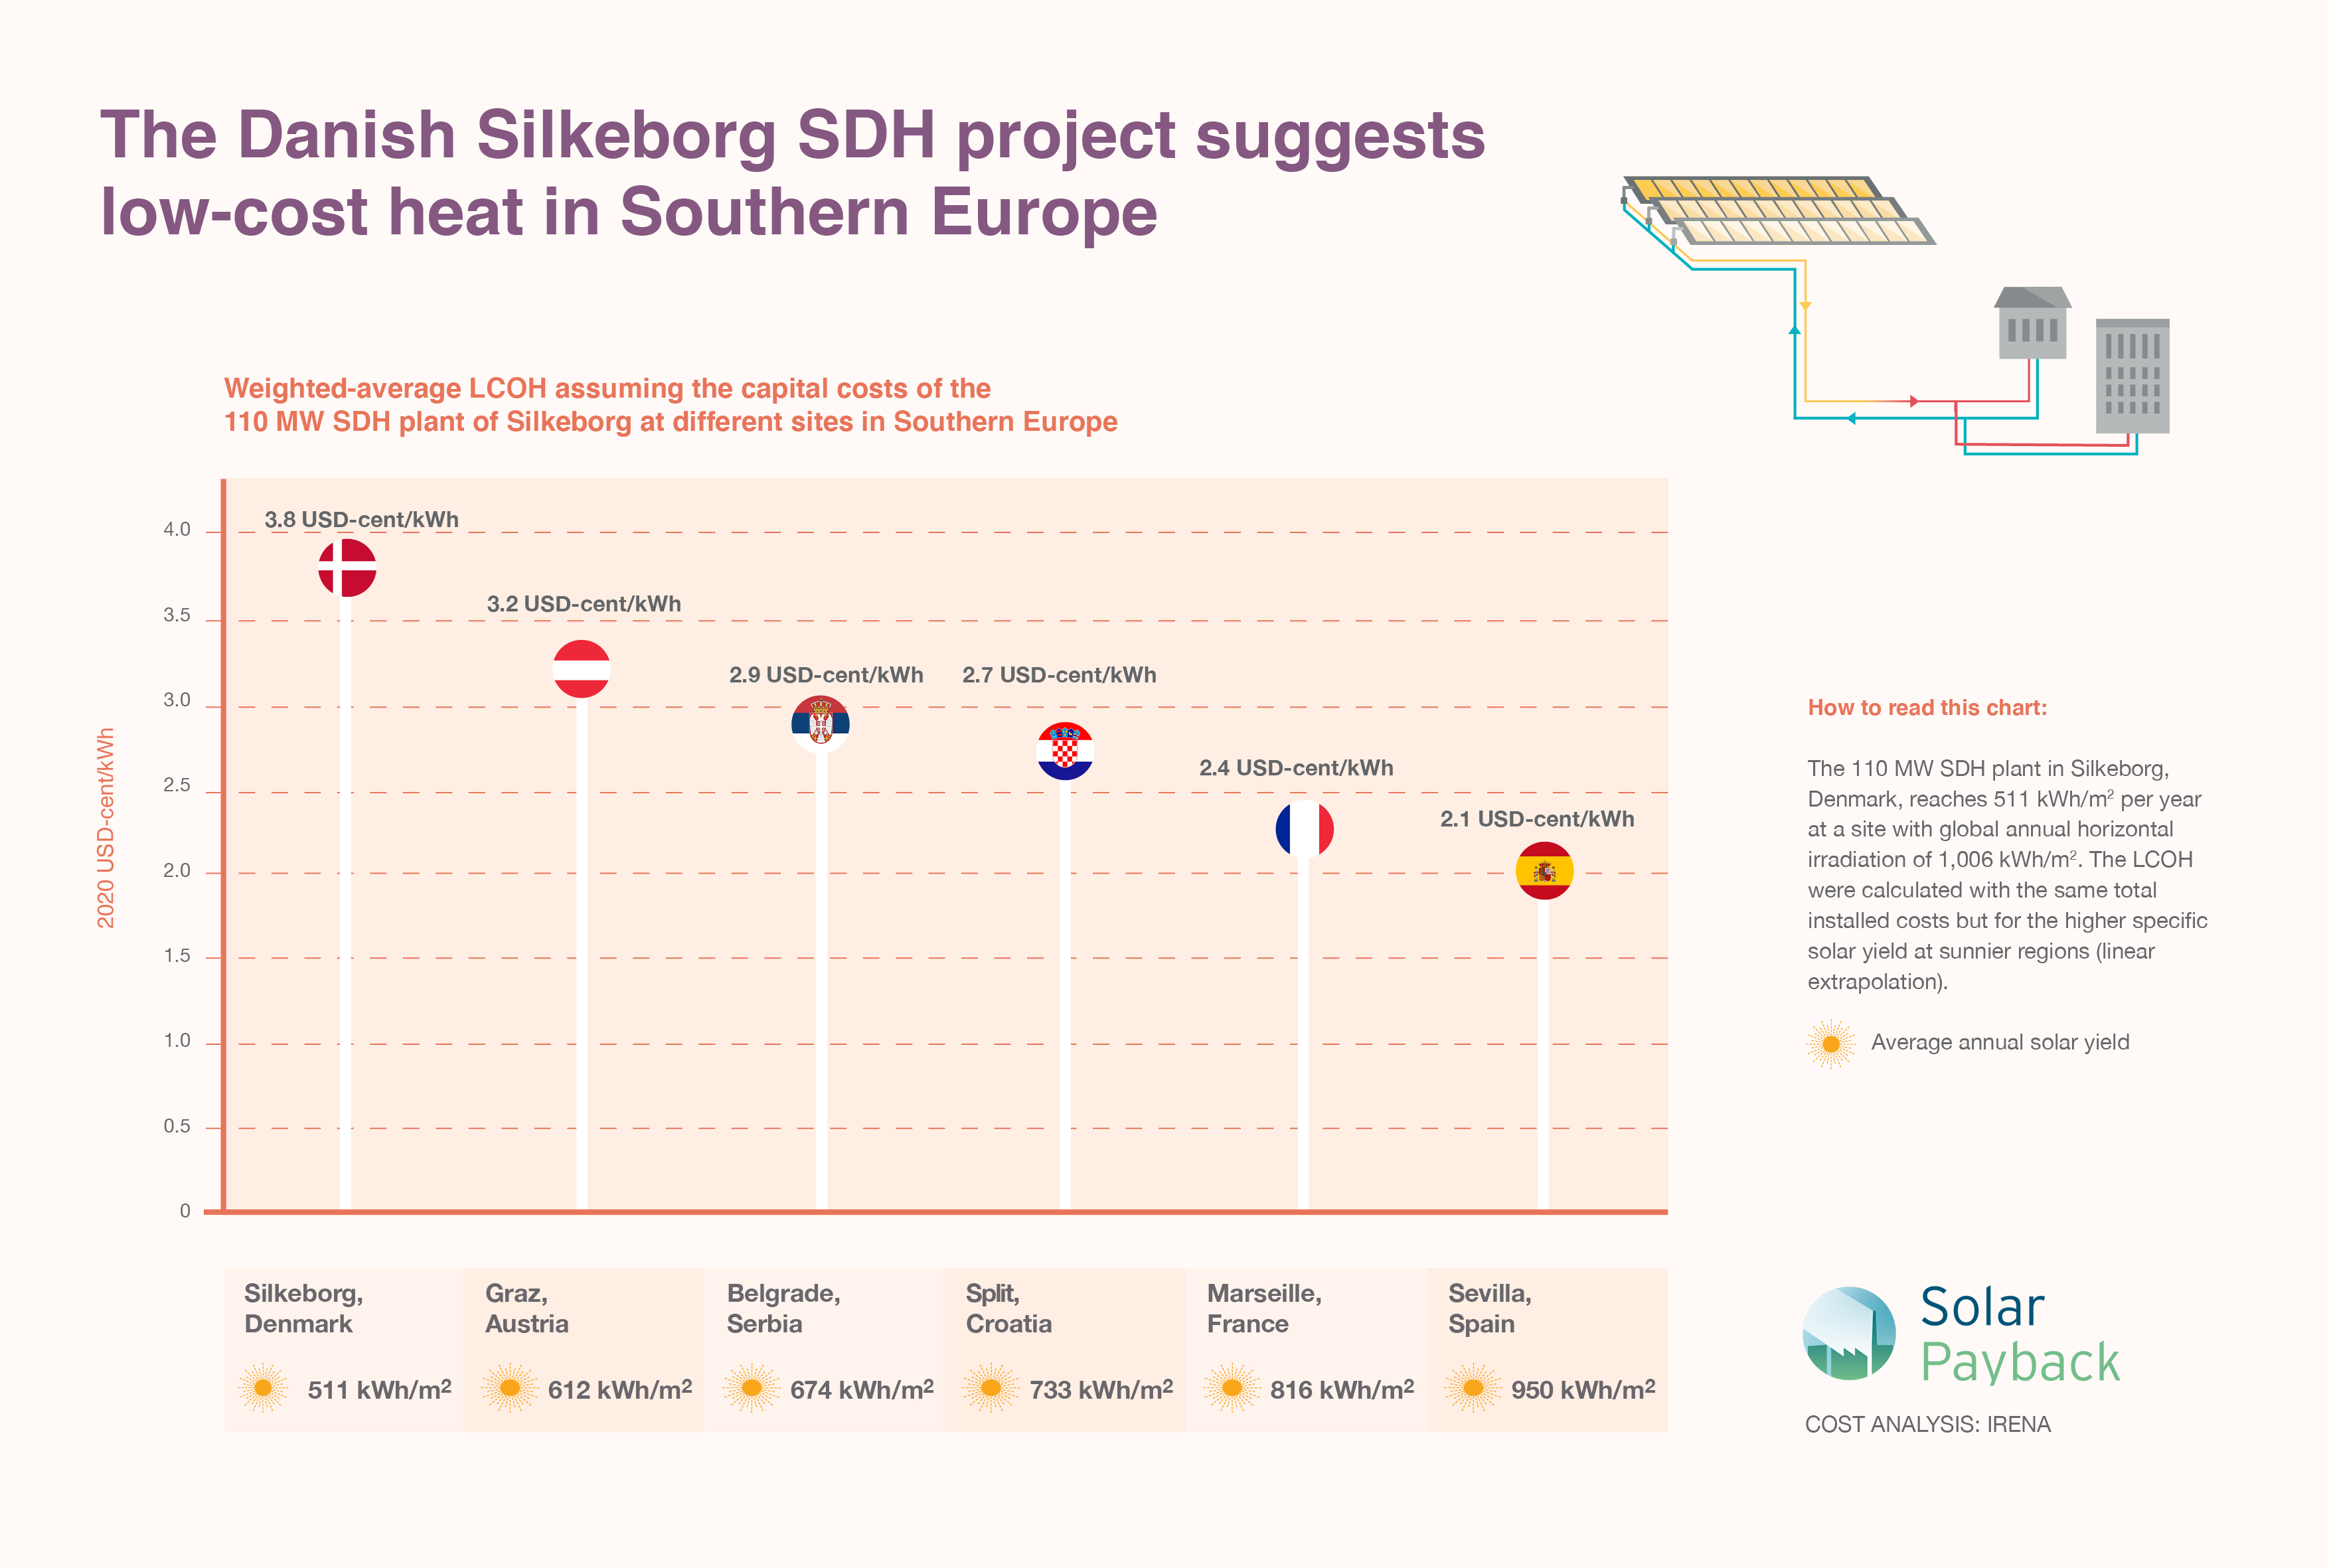
Solar district heating costs as various European sites

The 110 MW SDH plant in Silkeborg, Denmark, reaches 511 kWh/m2 per year
at a site with global annual horizontal irradiation of 1,006 kWh/m2. The levelised cost of heat were calculated with the same total installed costs but for the higher specific solar yield at sunnier regions (linear extrapolation).
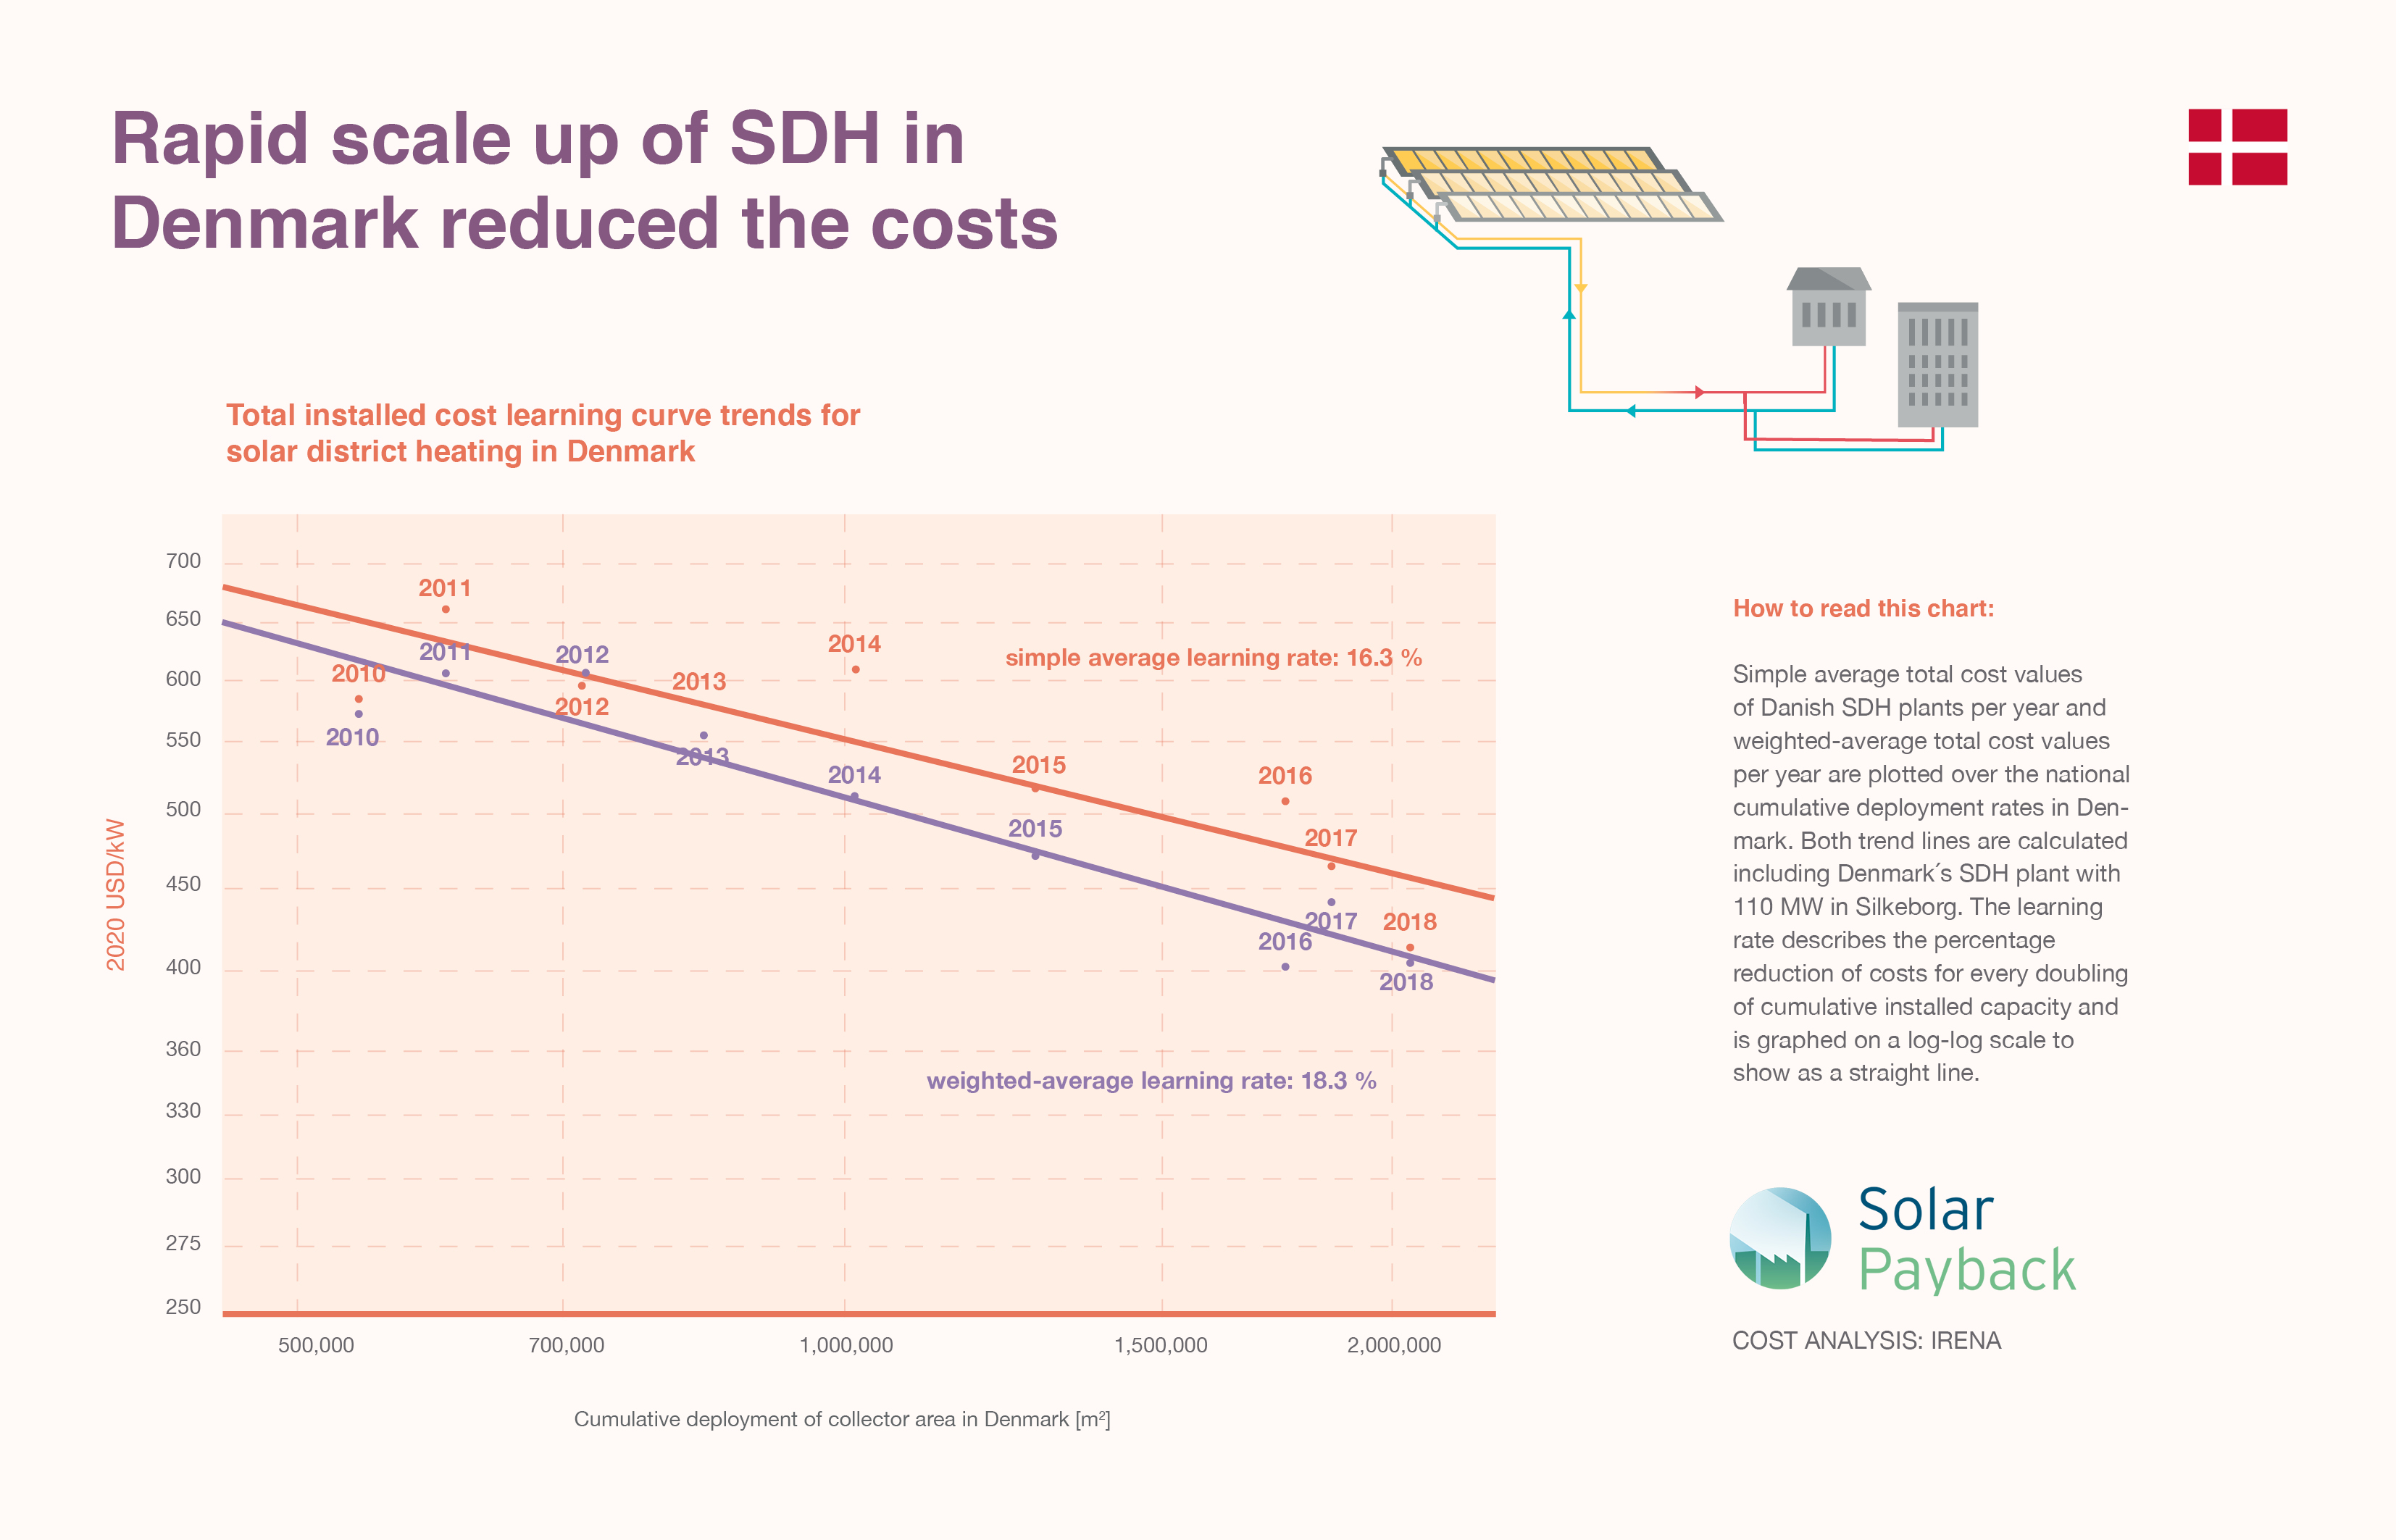
Learning rate for solar district heating in Denmark
In this chart simple average total cost values of Danish solar district heating plants per year and weighted-average total cost values per year are plotted over the national cumulative deployment rates in Denmark. Both trend lines are calculated including the Danish plant with 110 MW in Silkeborg. The learning rate describes the percentage reduction of costs for every doubling of cumulative installed capacity and is graphed on a log-log scale to show as a straight line.
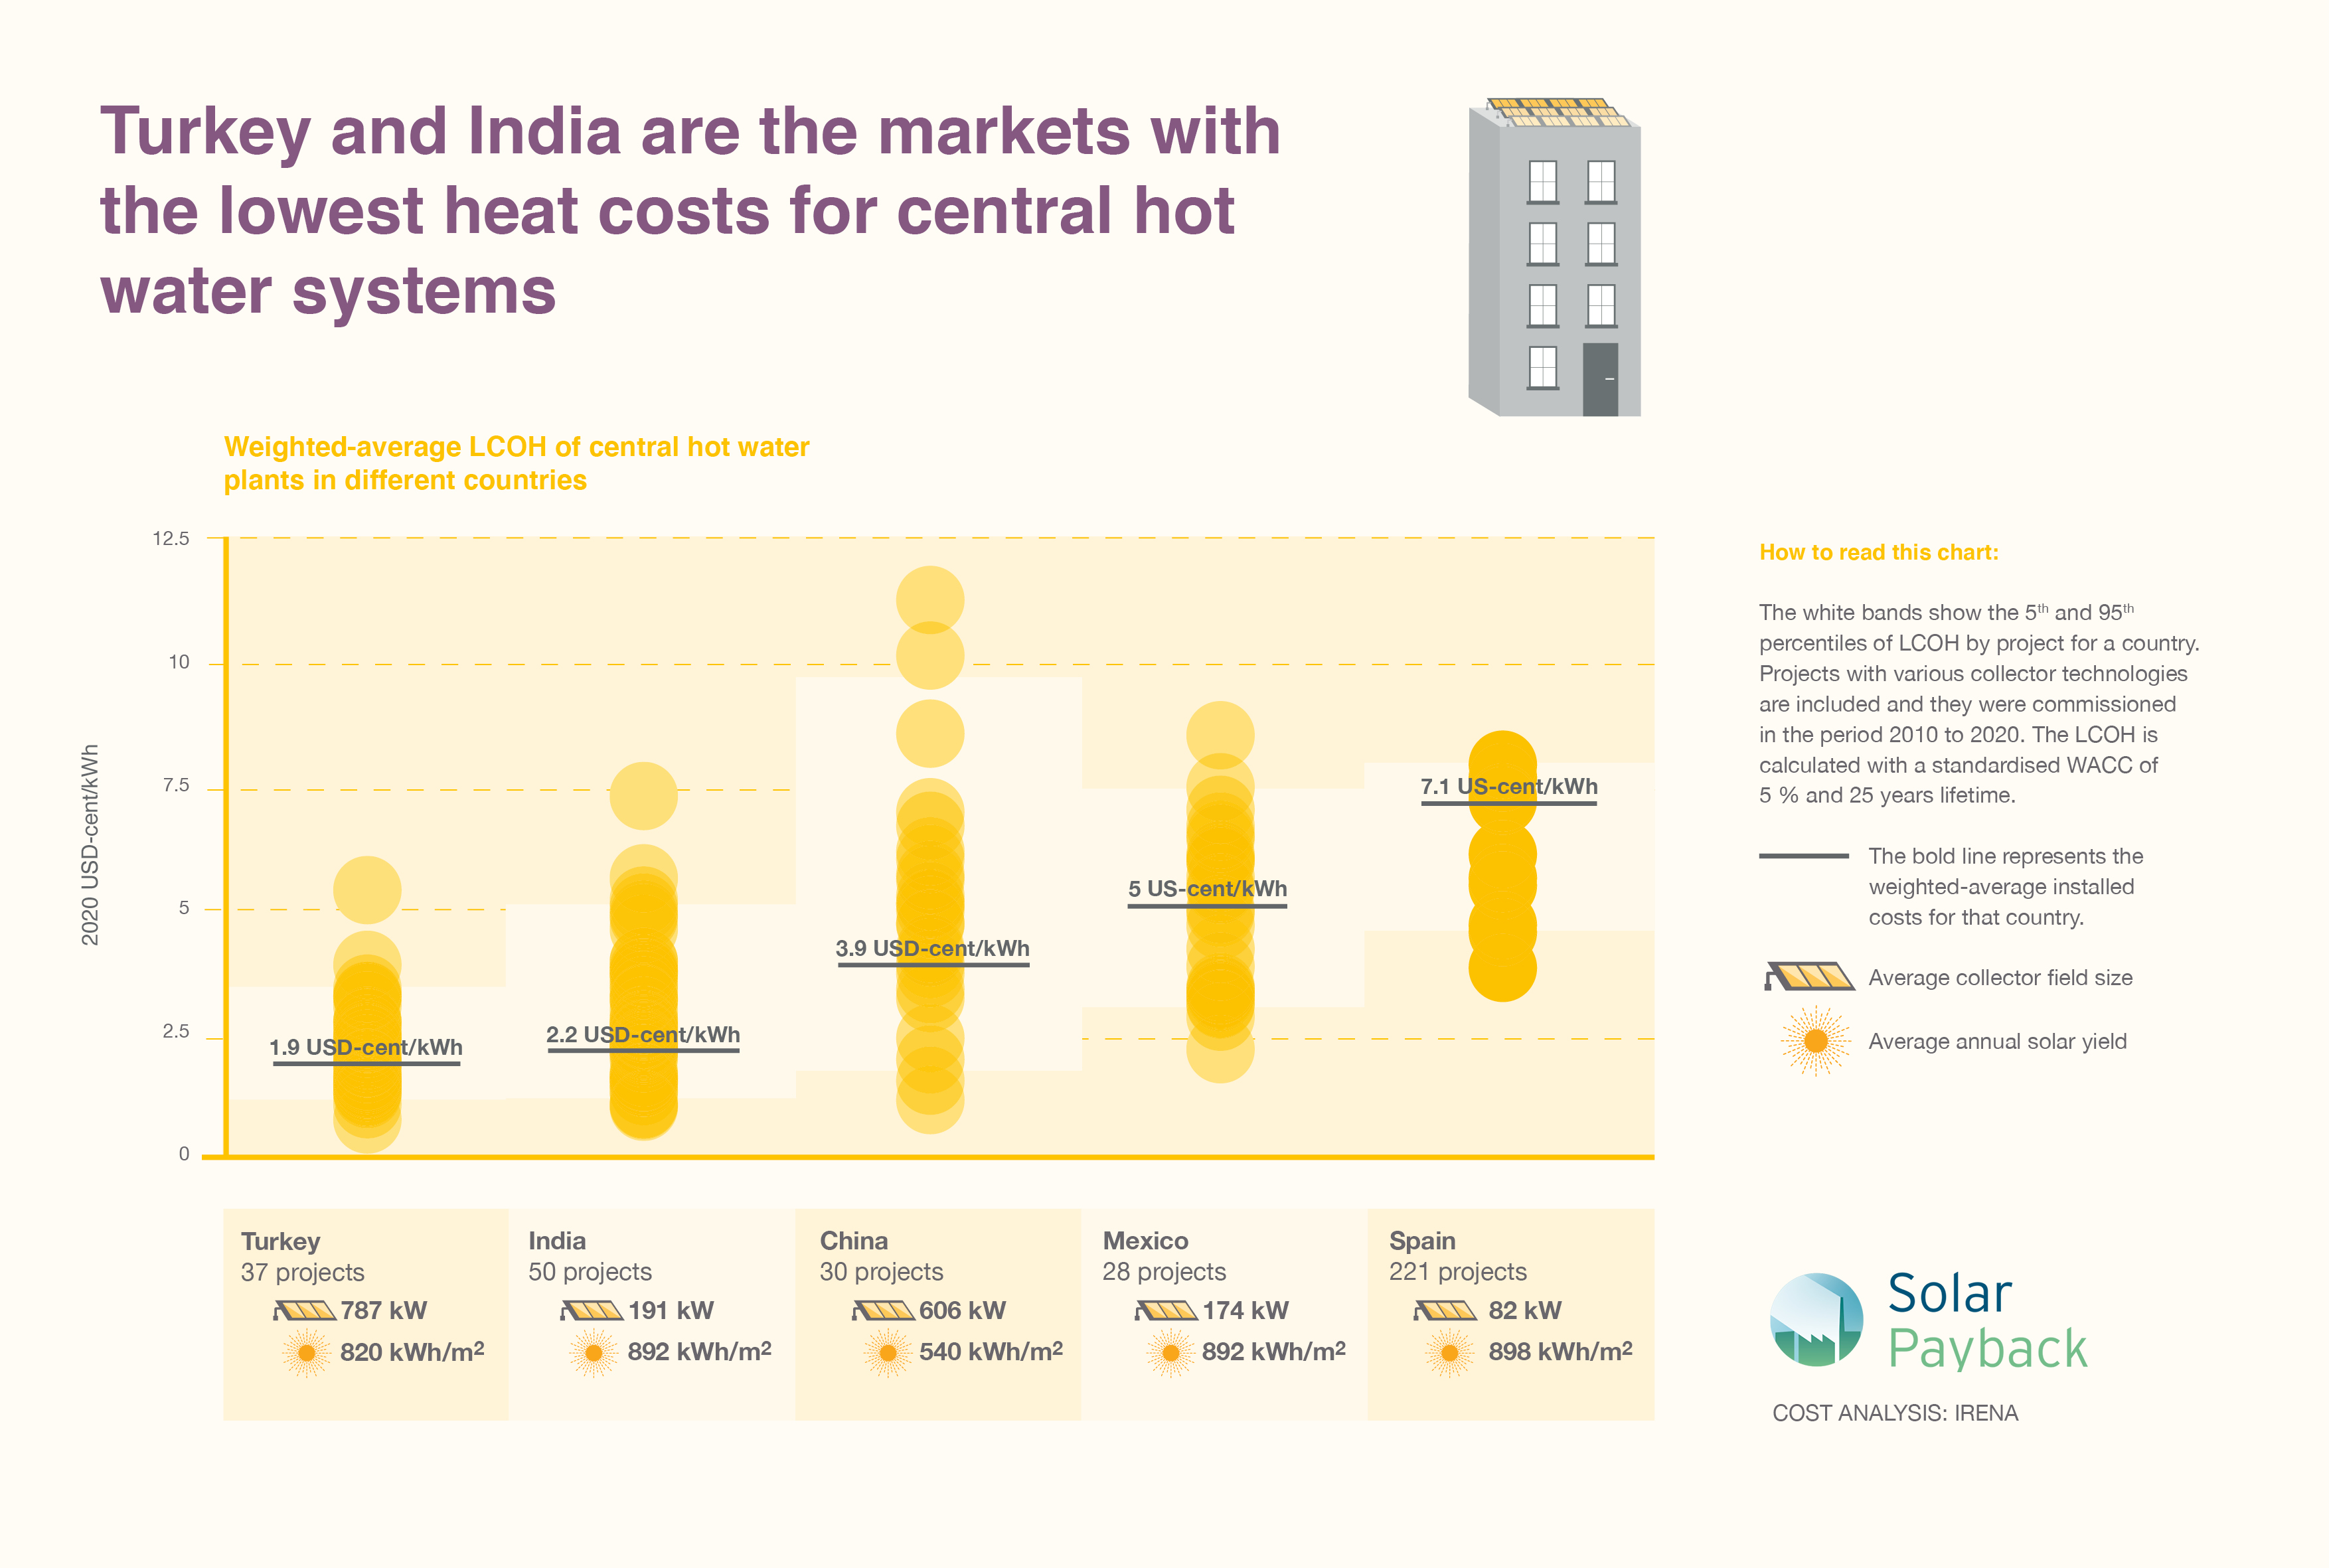
Heat costs for central hot water systems in various countries

Turkey and India are the markets with the lowest heat costs for central hot water systems. China ranks third with significantly lower average yield of the systems.
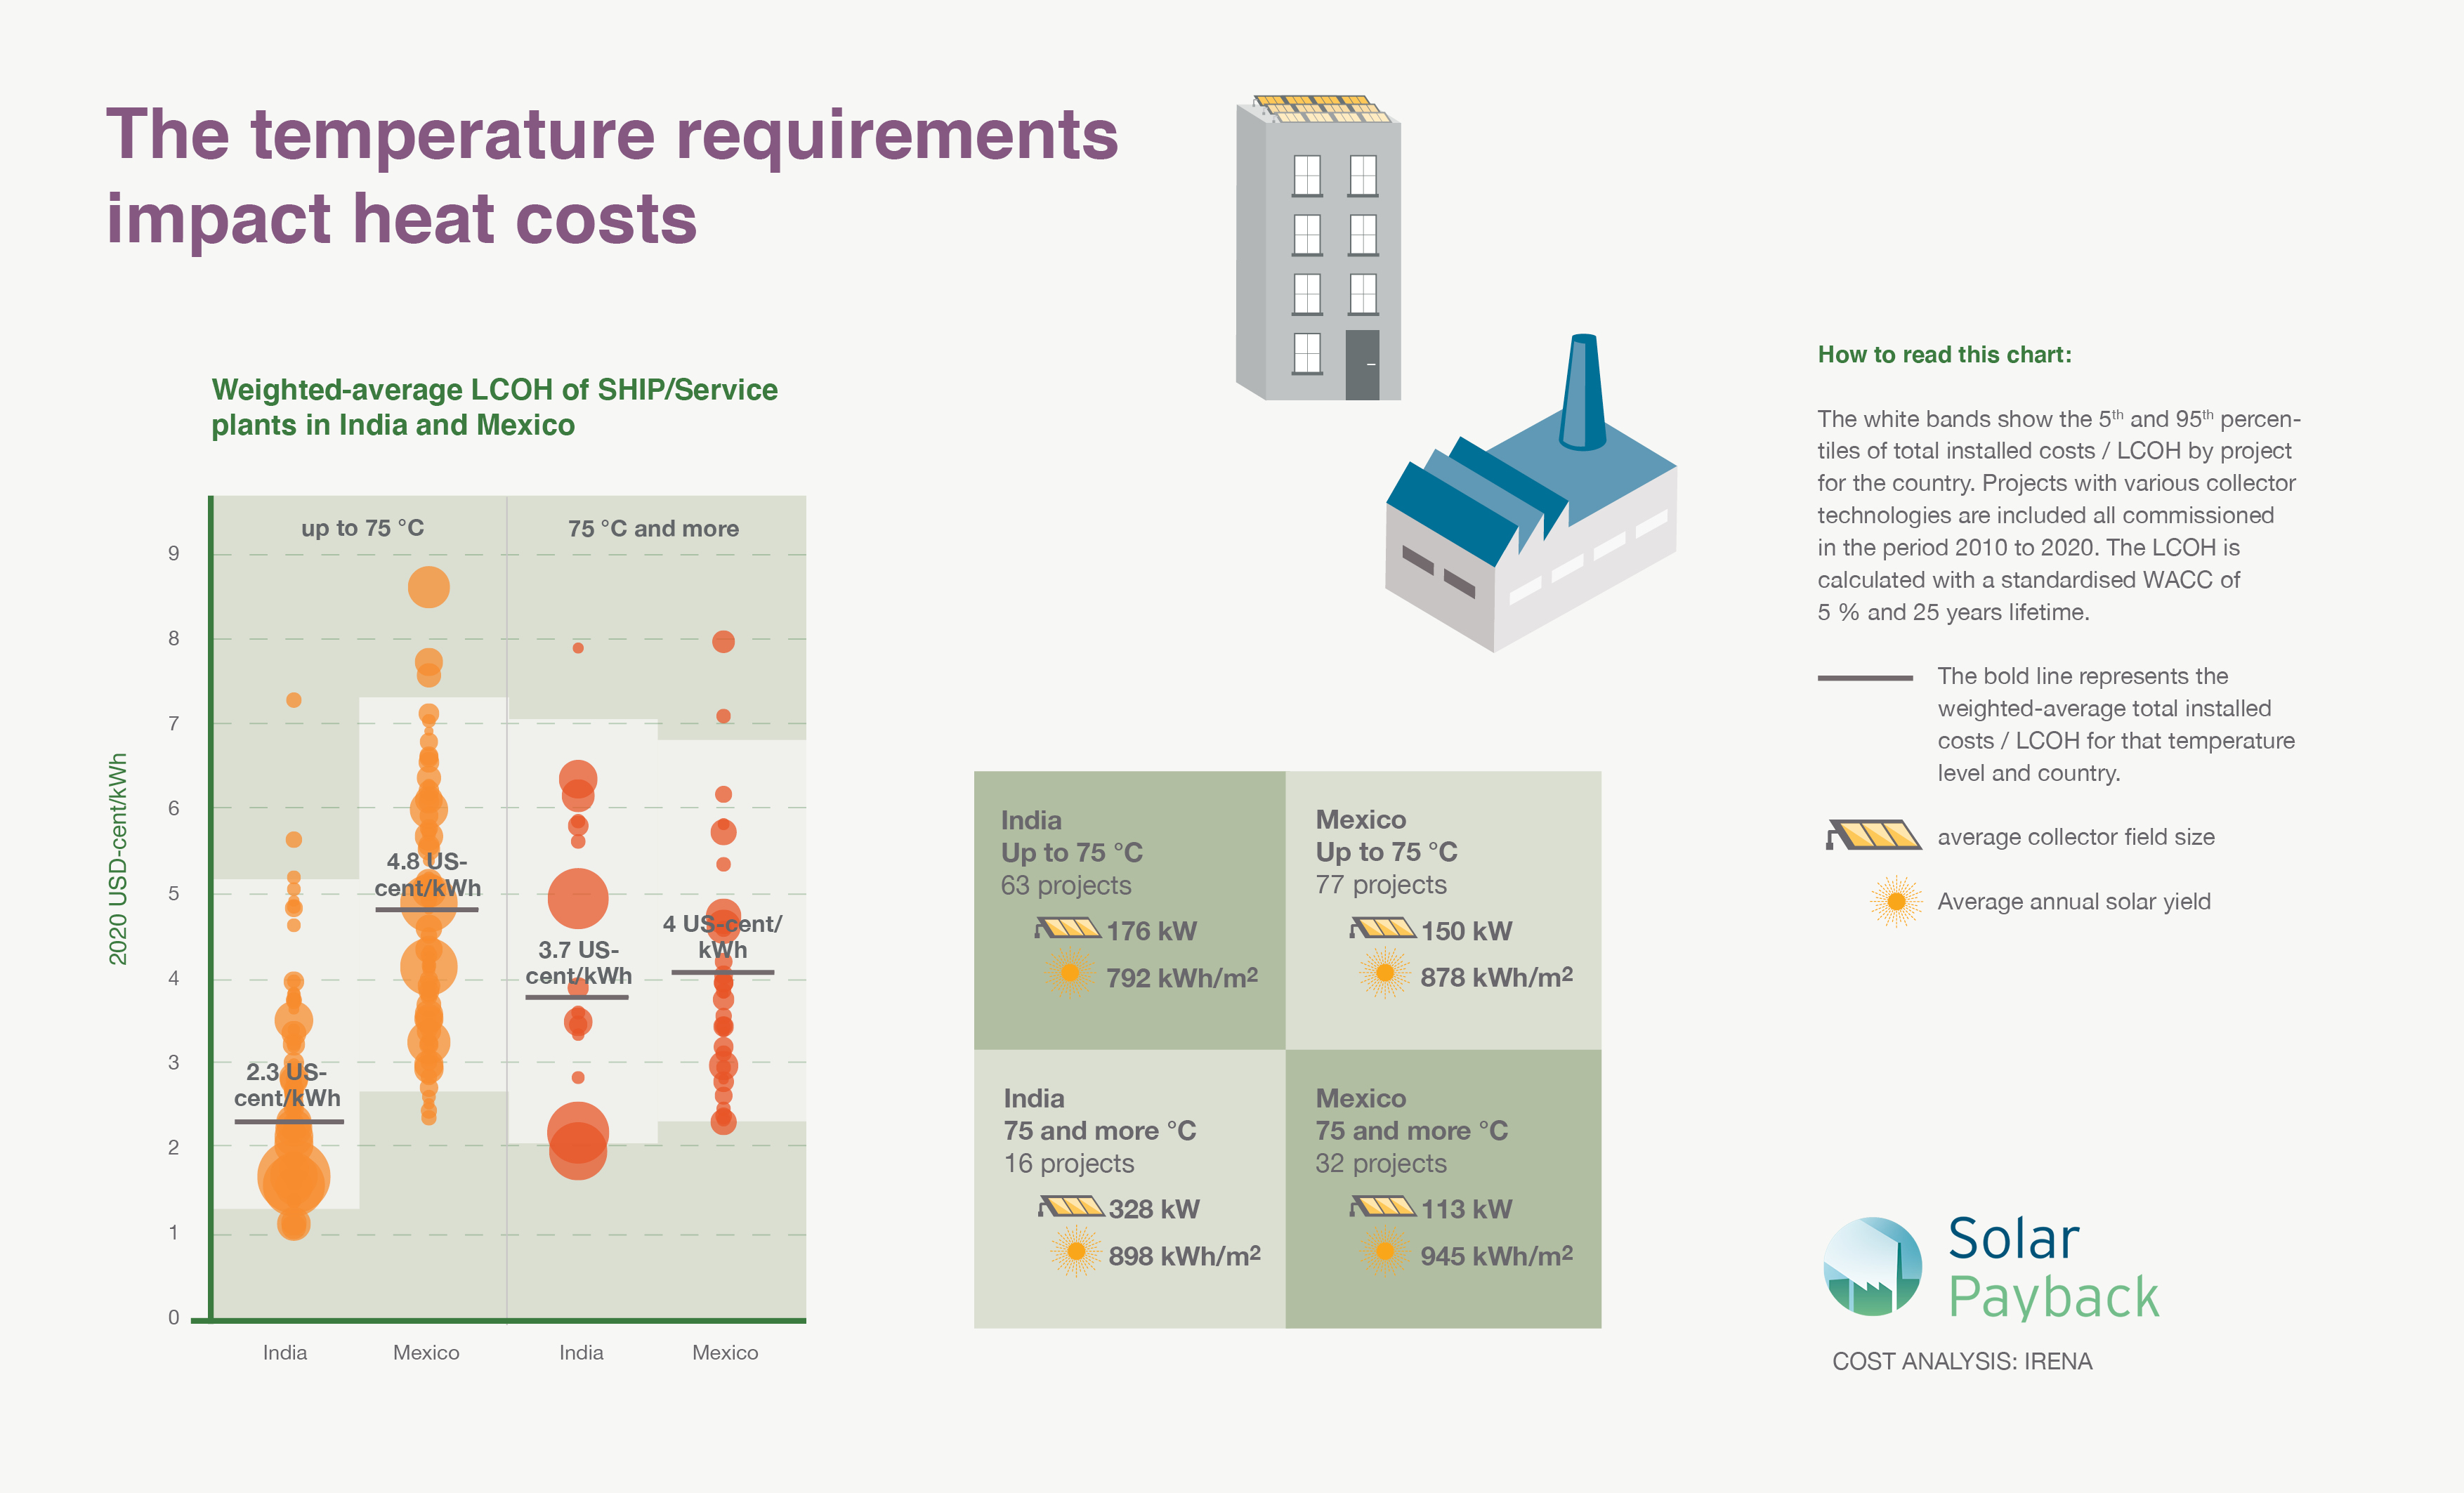
Temperature requirements impact heat costs

The chart shows the weighted-average levelised cost of heat for large solar thermal systems in Mexico and India on two temperature levels. In the range up to 75 °C the lower average costs in India are impacted by several solar thermal systems for public swimming pools with higher yields. Above 75 °C the costs in both countries are close together at around 4 USD-cent/kWh.
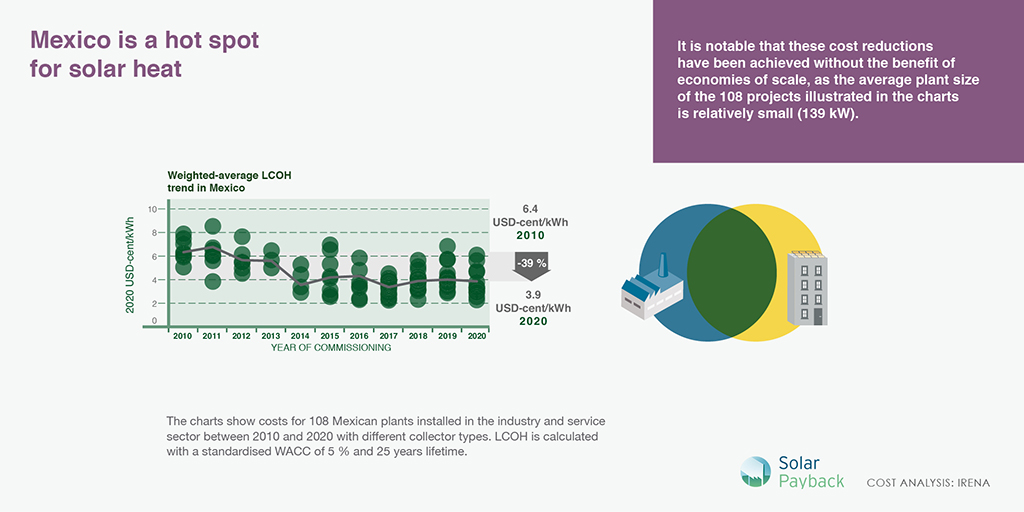
Mature markets accelerate cost reductions of large solar heat plants

In Mexico, the costs of commercial and industrial solar heat plants have come down 17 % in the last decade due to production output optimisations, more efficient logistics and high competition between well-established project developers. The chart shows the weighted-average Levelised Cost of Heat (LCOH) trend in Mexico between 2010 and 2020.
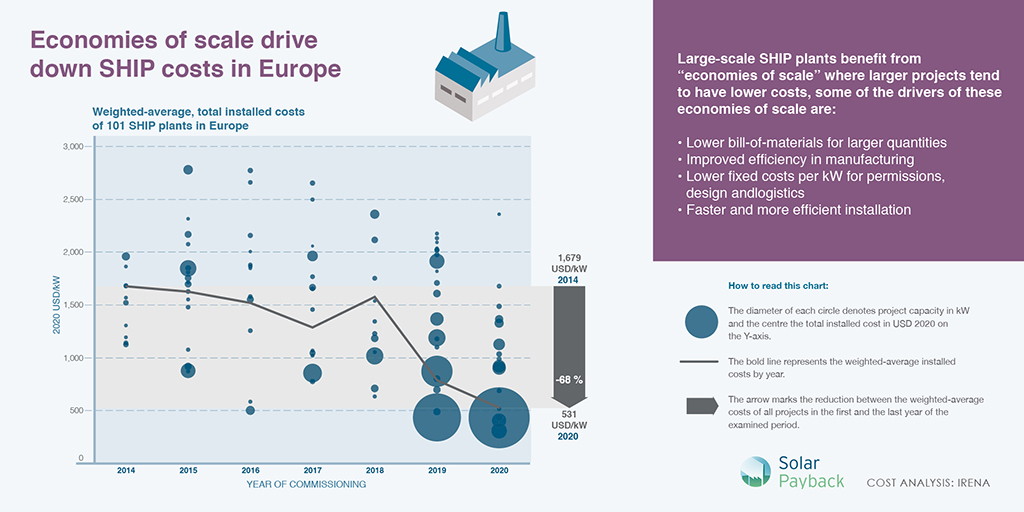
Economies of scale drive down SHIP costs in Europe
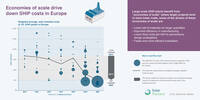
This chart illustrates weighted-average total installed costs of 101 SHIP plants in Europe - commissioned between 2014 and 2020. At the end of the observed periods the market profited from large-scale SHIP plants which tend to have lower costs because of “economies of scale".
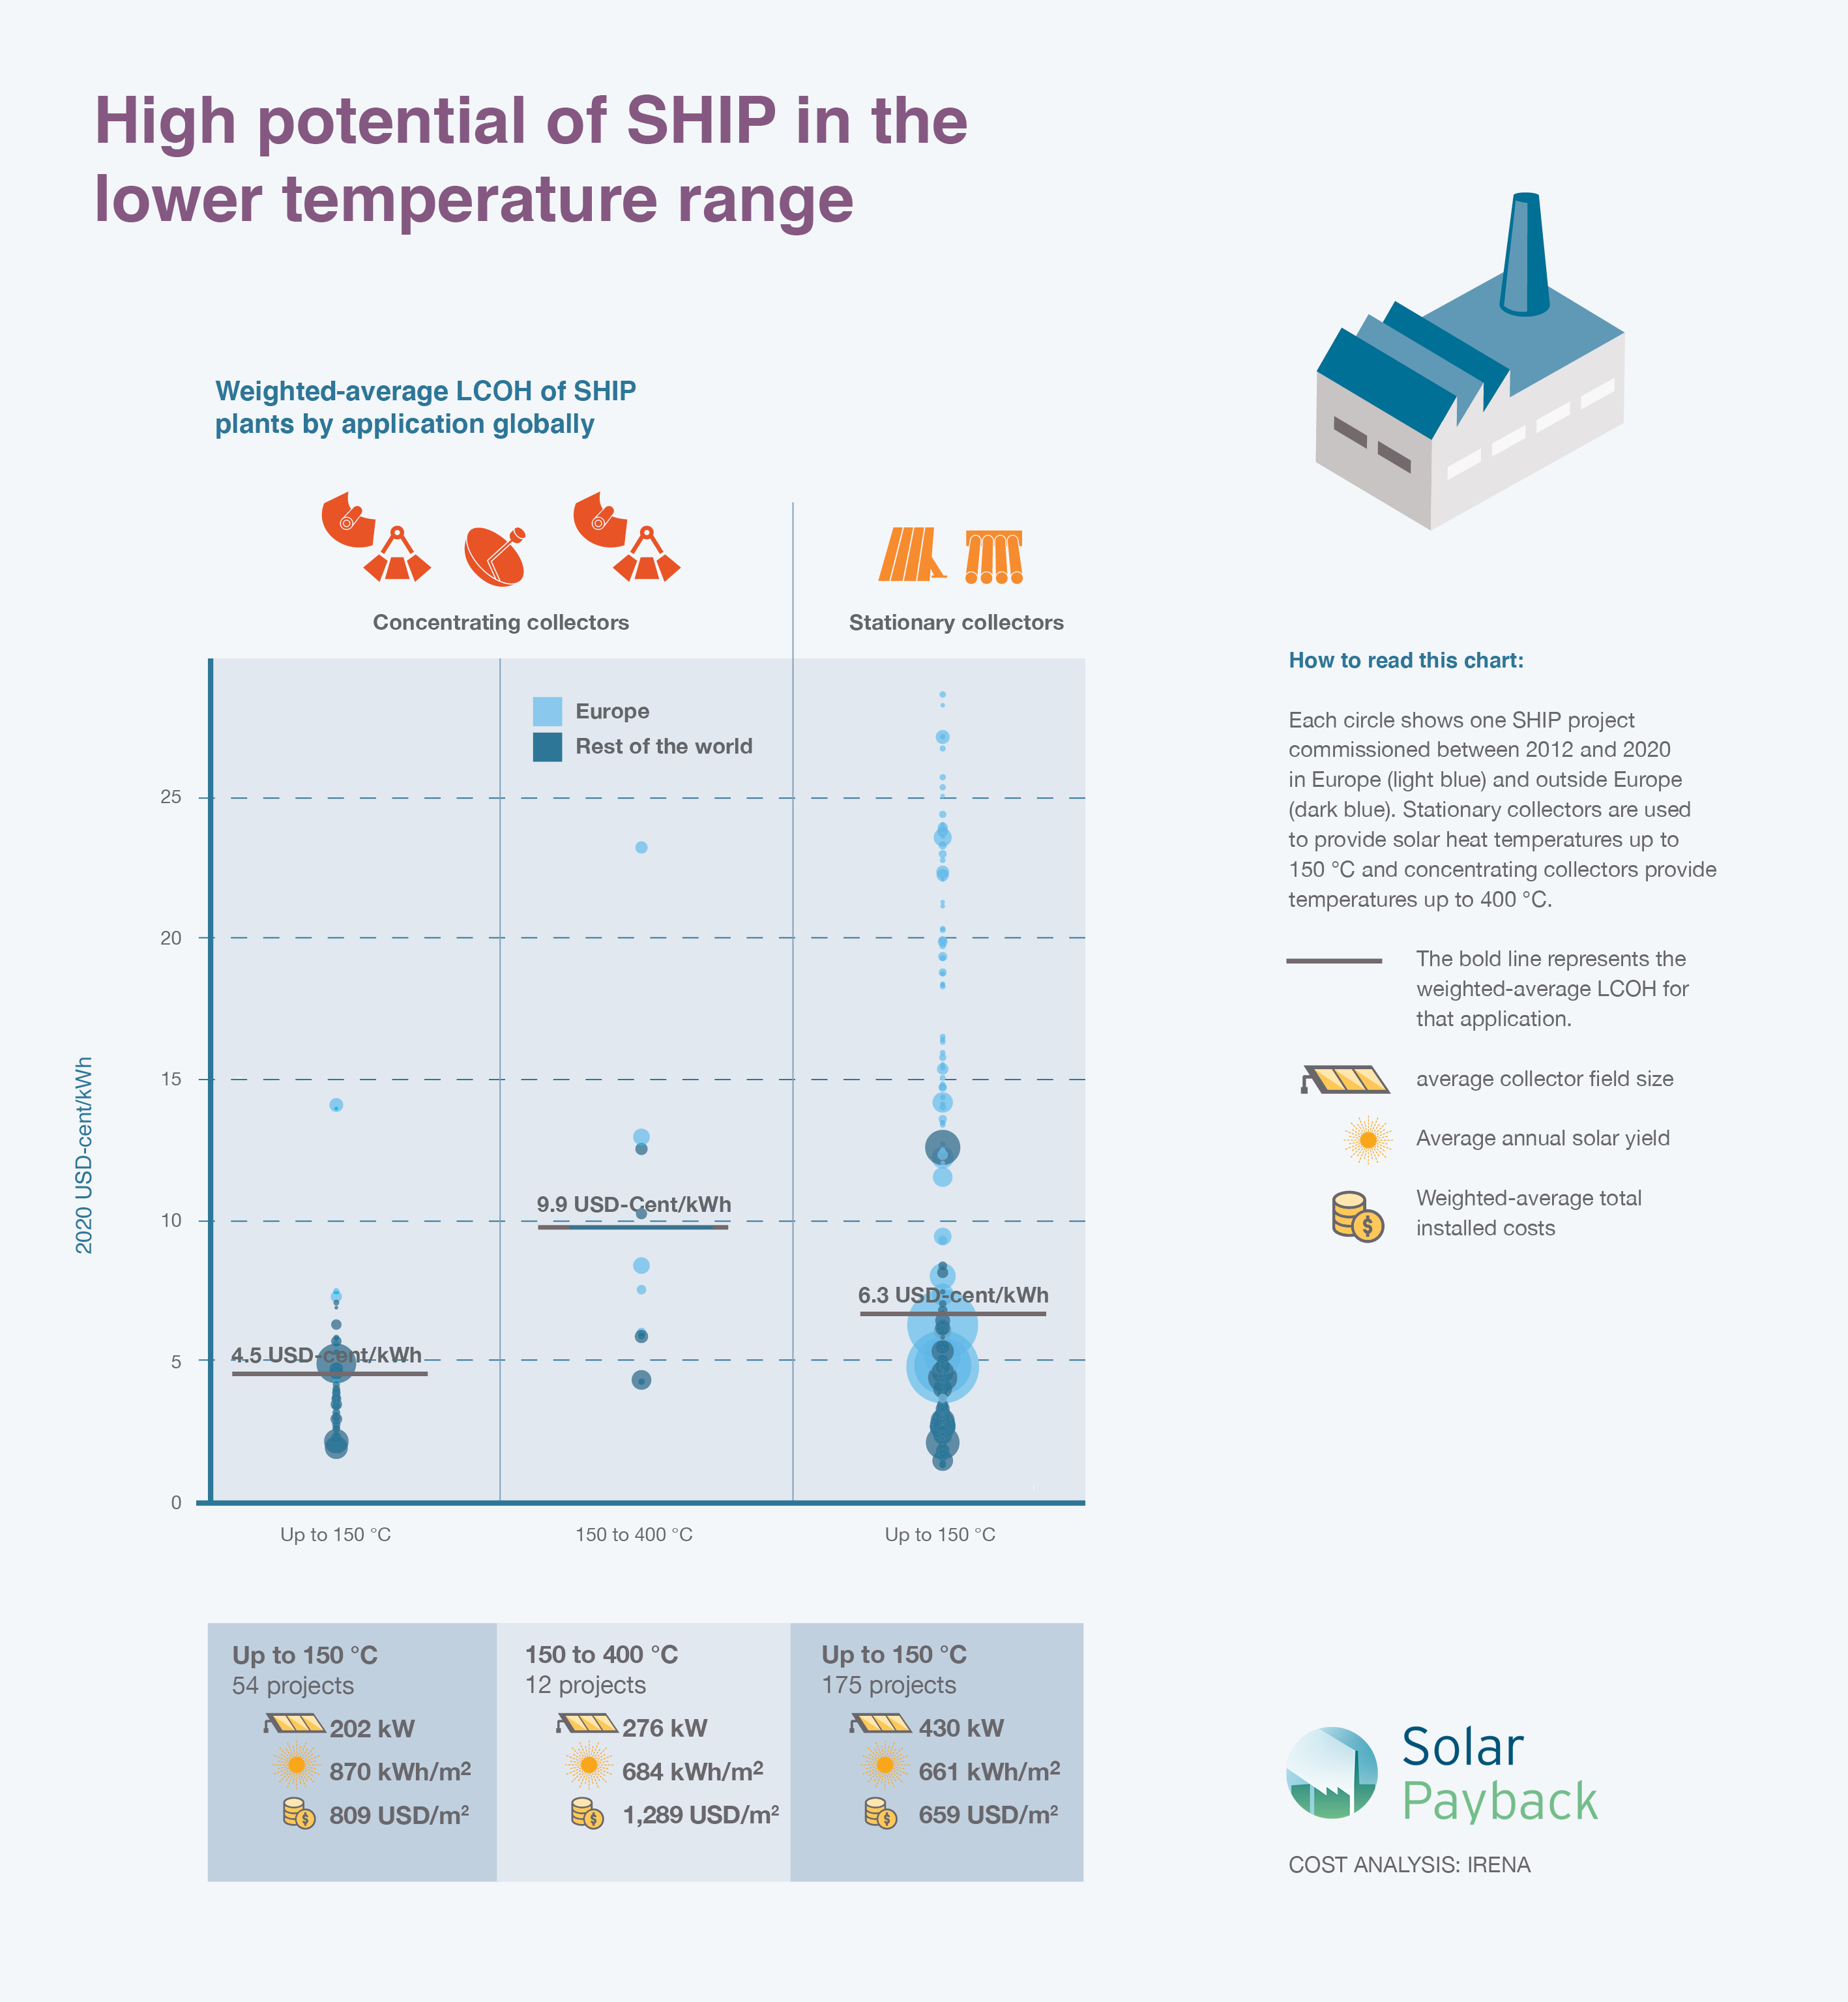
Solar heat costs depending on the temperature level supplied
On this chart each circle shows one SHIP project commissioned between 2012 and 2020 in Europe (light blue) and outside Europe (dark blue). Stationary collectors are used to provide solar heat temperatures up to 150 °C and concentrating collectors provide temperatures up to 400 °C.
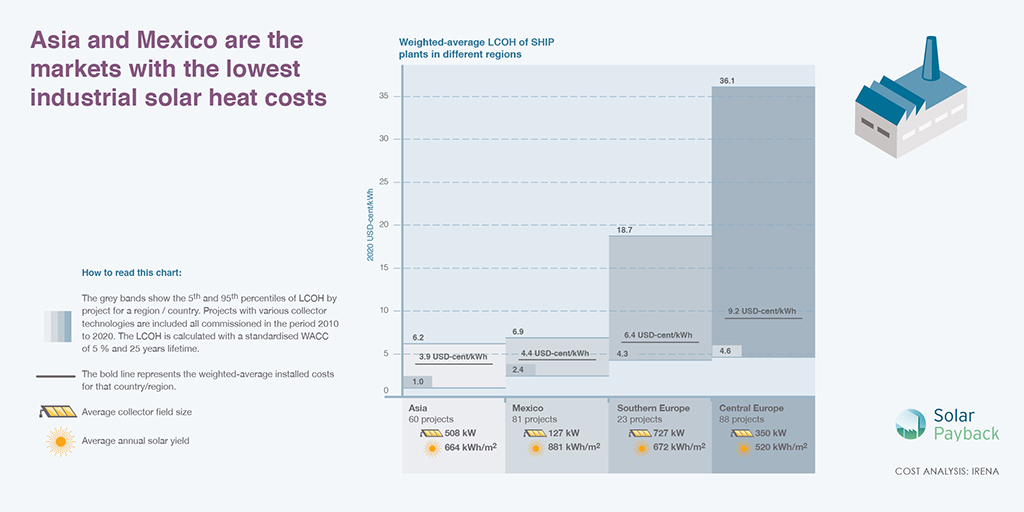
Asia and Mexico are the markets with the lowest industrial solar heat costs
The regional average LCOH for SHIP plants ranges from a low 3.9 USD-cent/kWh in Asia to a high 9.2 USD-cent/kWh in Western Europe. Besides economies of scale, variations in cost structure and irradiation levels also impact the LCOH.
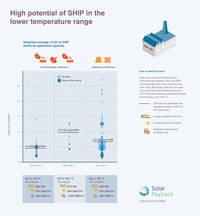
High potential of SHIP in the lower temperature range
The most popular applications for SHIP plants globally are processes that need heat up to 150 °C. This segment makes up 30 % of the global industrial heat demand and solar heat costs are generally lower in this segment. The lowest weighted-average LCOH values of 3.8 USD-cent/kWh for solar heat up to 150 °C are achieved in the service of factories in Asia and Mexico.